Google is such a behemoth in the digital world everything coming out of its innards is dissected with envy and copied vigorously. It was obviously the case with its OKR system : these “Objectives and Key Results” are used within Google to set ambitious goals and track progress. AramisAuto - an e-commerce site for cars that went through a successful IPO in 2021 - followed suite and discovered managers tracked a large number of numbers, explained the ups and downs to staff, but had few initiatives other than “work harder” at what they already did.
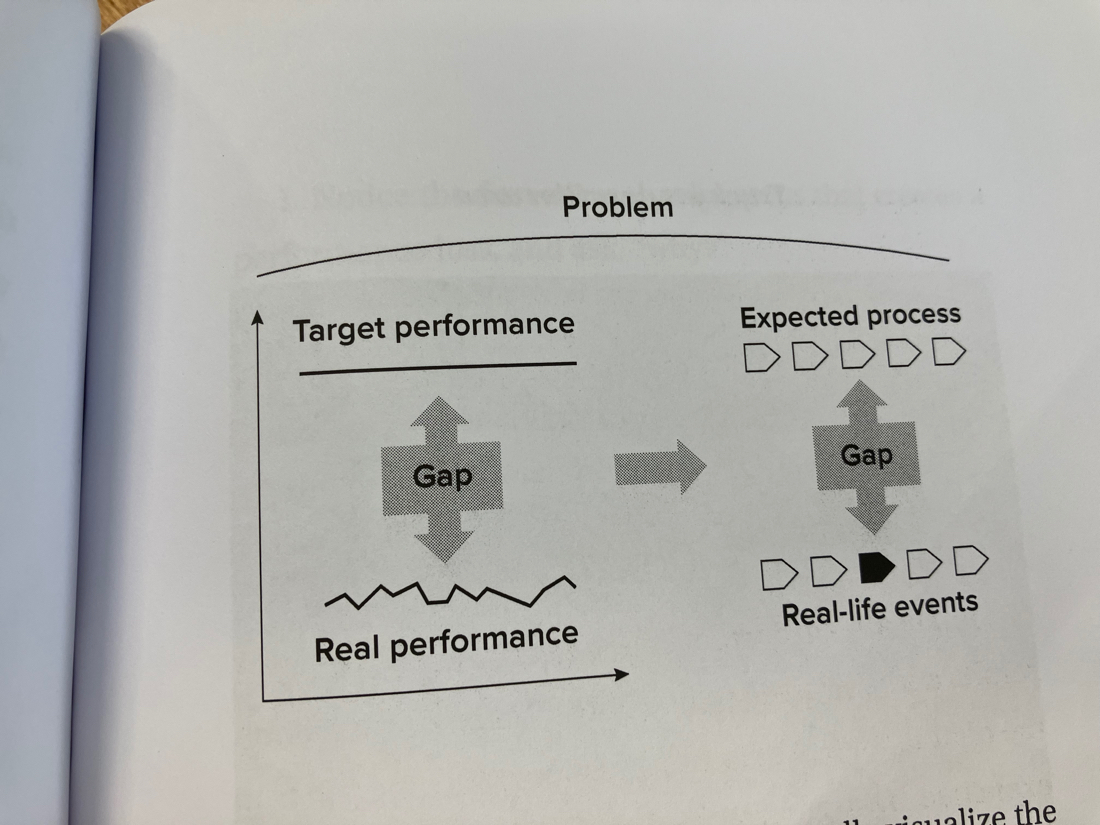
Lean practitioners know numbers are often just a glance through a rear-view mirror : they won’t show you the way to do anything. And they can be part of the Plan (what’s the gap?), Check (is the gap filled?) and Act/Adjust (can the improvement be sustained and replicated?) in any PDCA cycle. But are of no use for the Do (what are we testing to fill the gap?).
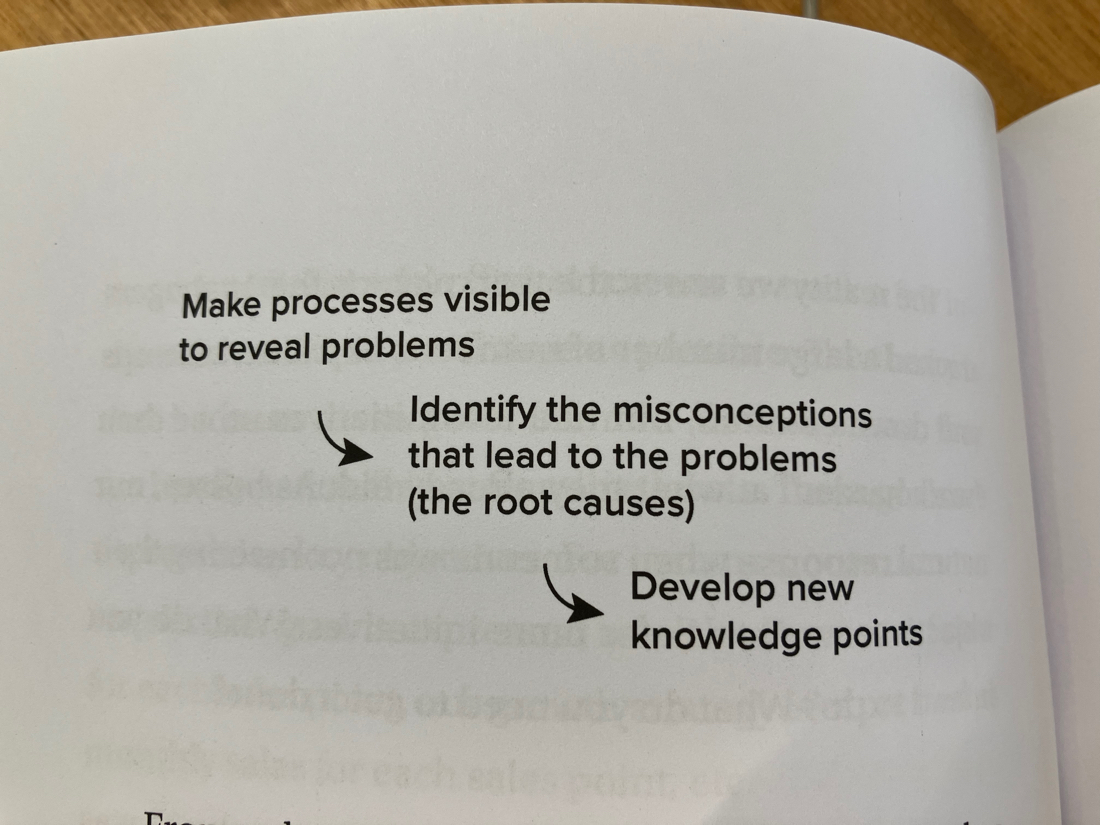
“What is the problem you’re trying to solve?” was the sensei’s starting point. People rarely expected such a direct question, and, when they fumbled their response, the sensei would say to start by visualizing your process. For instance, right from the start as we wanted to improve the on-time delivery from our factory, the sensei suggested we draw squares on the ground to place in advance of each truckload of cars. Here, again, we misunderstood - the sensei was not solving the performance problem. He was trying to find the process problems by making the situation visible. He as constantly looking for things we couldn’t see physically: results. To him, processes came down to results and the activities to achieve these results. A problem was therefore anything that interfered with the activity and lowered the results.

The consequential shift suggested by the Lean framework (as recommended in the highly enjoyable Raise the Bar) is focusing on singular events (no average, no Pareto) in the actual process, at the Gemba.

But that’s already the next step. First is visualizing: what are your squares on the ground?

